Presentation of Budget Data
As you plan and manage your marketing activities, you enrich planning activities with budget data. In this chapter, you will learn how to present the data in a meaningful way for analysis and comparison.
In the , you use budget views to control which budget data is displayed. You can also calculate your own data by entering formulas and display it for each activity in a column (see chapter Customized Budget Calculations). The budget views are defined by you or another user. Where necessary, saved views can be published for all users or for specific user groups. Note that you can edit and publish only your own views.
If you want to restore the default view, choose > > Budget> > Default View.
If you open the dropdown list and select Manage views..., the following dialog box opens:
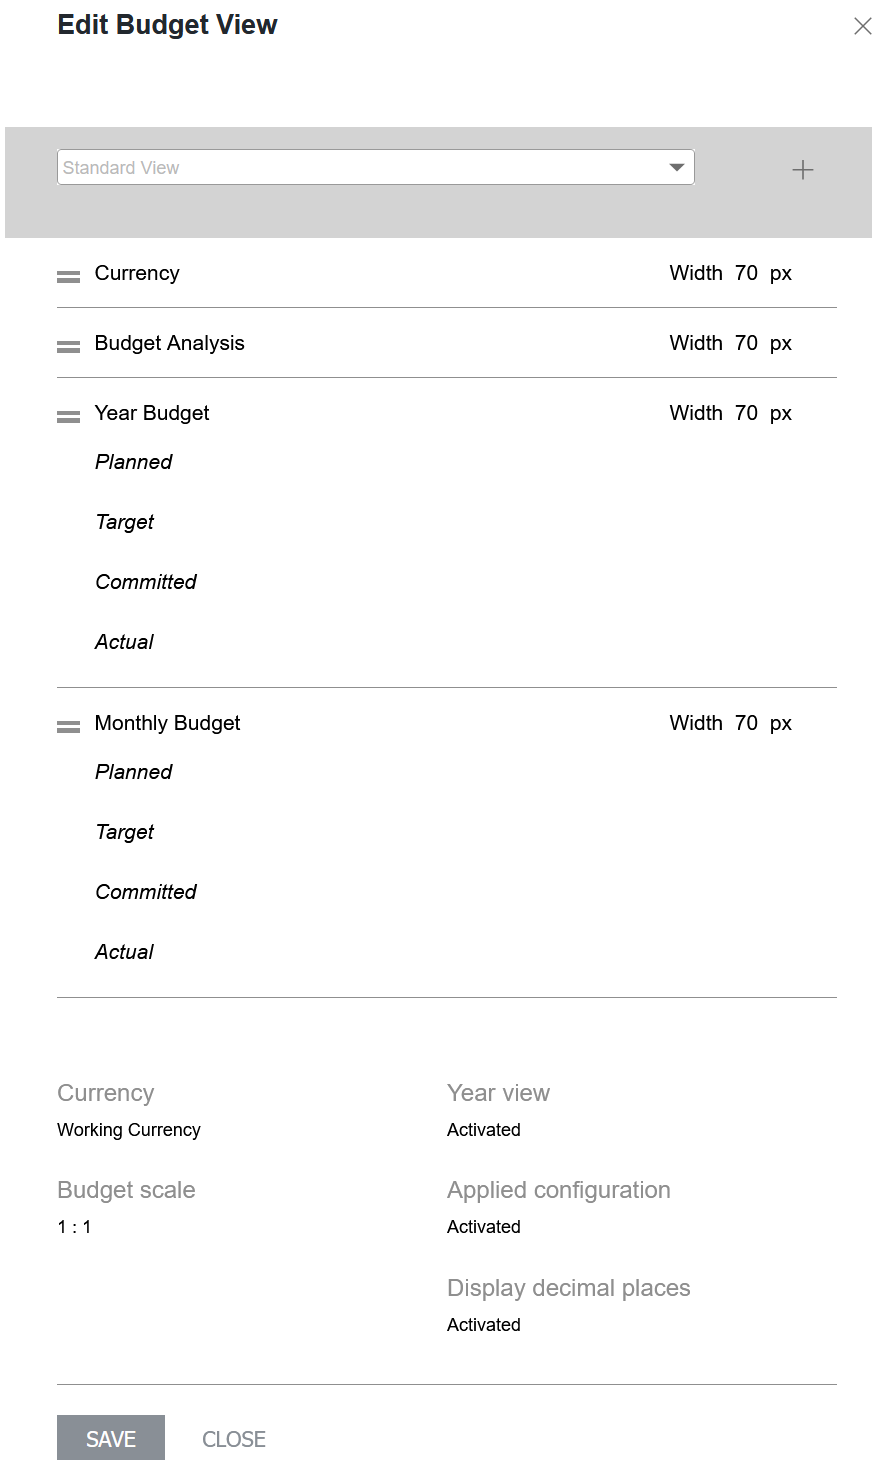
In the upper area, you can manage the budget views; for example, you can define the name or select the view that you want to edit. Below that, you can select which columns and other elements are displayed in the view. You can also define the order in which the data is displayed in the planning area: data at the top of the list is displayed in the planning area on the left.
Note
For the order of the columns, note that data from the yearly or monthly budget can only be moved as a block and the order of the data within the yearly or monthly budget is fixed.
The default width of the columns is 70 px. You can change it to any width. Note that the yearly and monthly budgets contain several columns. You enter a column width for the yearly and monthly budget and each column is displayed with this width.
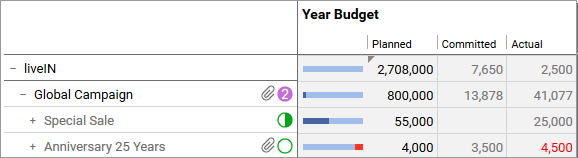
The helps you to plan your budget by highlighting inconsistencies with colored triangles for the budget values in question. The font color of the budget value can also indicate inconsistencies or provide you with information about the origin of the budget value.
|
|
A gray corner in the budget cell of a parent activity indicates that one or more sub-budgets are causing problems |
|
|
A red corner join in the budget cell may indicate one of two inconsistencies:
Note: In a top-down year, the red corner is only displayed if discrepancies in the working currency occur. |


Note
When you move the mouse over a color-coded budget cell, a balloon containing an info text about the detected inconsistencies is displayed.
A gray font indicates that the budget value was calculated automatically (for instance, from an entered PO, invoice, or sub-budget).
A black font indicates that the value was entered in the budget view manually. Note that this is possible only for planned values.
A red font indicates that the value exceeds the planned value and that no more of the budget is available in the Remaining column. In the Projected column, a red font indicates that the value is higher than the planned value, or that no planned value is entered although a projected budget is available.
The following data and settings are possible:
For each activity, you can display the budget data from the planning phase (planned and target budget) as well as from the management phase, such as Committed, Actual, or Remaining. For detailed information on the data from the management phase, refer to the chapter Expenses.
You can access the budget to create your own budget calculations based on formulas and display them in a column. For more detailed information, see the chapter Customized Budget Calculations.
The budget utilization is displayed as follows:
-
The dark blue bar represents the proportion of the budget that has been consumed.
-
A light blue bar represents the proportion of the budget that is still available.
-
A red bar represents budget overruns.
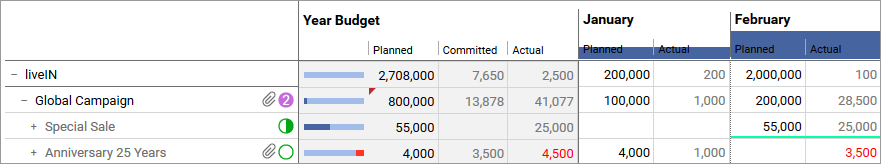
Above the monthly columns, a schematic budget utilization view based on the values of the month in question in relation to the yearly budget is also displayed.
You can show the following basic attributes in separate columns:
-
Responsible person
-
Duration
-
External ID
-
Element ID
-
Activity Type
-
Element notes (See the detailed view of the General tab)
If you open the context menu when displaying an additional piece of information in the Year Budget column, you can view the menu item. If you display the Responsible person, Duration, External ID, or Element ID information, the function opens the activity detailed view on the General tab. If you display a dimension, the editing dialog box for the dimension for this activity opens.
You use dimensions to describe elements uniformly in the Planner. In a dimension, for example, you can record which target group the marketing activity is aimed at. Dimensions are set up specifically for your system.In the budget view, you can selectively show the dimensions with the values for each activity.
To manage budgets in multiple countries, you can assign various currencies to the planning activities. The administrator specifies which currencies are available in the system in the settings. To compare budgets from different countries, the administrator also defines a reference currency and corresponding exchange rates for each year. Other currencies are converted into the reference currency using the exchange rates.
In the budget view, you can choose whether the budget data is displayed in the working currency (i.e. in the currency defined for the activity) or in the reference currency. This applies to the Plan, Target, Committed, Actual, Projected, Remaining and MDF. If the use of a secondary exchange rate is activated in your system, you can choose between primary and secondary exchange rate. Note that now the budget view can simultaneously display data in the reference currency calculated with both exchange rates. In this case, if you enter values directly in the budget view, this data will be converted to the working currency using whichever exchange rate is applied.
Note
Note that KPIs and reports are calculated using the primary exchange rate only.
You can also display the currency of the displayed data in a column.
To ensure that it is also easy to record and compare high amounts, you can select the budget scale for the budget view.
For example, € 1,150,560:
|
Setting |
Diagram |
|---|---|
|
1:1 |
1,150,560 |
|
1:1,000 |
1,150 |
|
1:1000000 |
1 |
|
1:1000000000 |
0 |
You have the option to display budget data exactly with 2 decimal places or rounded with the setting.
Examples:
|
Setting Activated |
Setting Deactivated |
|---|---|
|
1,566.99 |
1567 |
|
12,356.12 |
12,356 |
|
18,542.50 |
18,543 |
|
1,500.00 |
1,500 |